This post is part of our Scaling Kubernetes Series. Register to watch live or access the recording, and check out our other posts in this series:
When your cluster runs low on resources, the Cluster Autoscaler provisions a new node and adds it to the cluster. If you’re already a Kubernetes user, you might have noticed that creating and adding a node to the cluster takes several minutes.
During this time, your app can easily be overwhelmed with connections because it cannot scale further.

How can you fix the long waiting time?
Proactive scaling, or:
- understanding how the cluster autoscaler works and maximizing its usefulness;
- using Kubernetes scheduler to assign pods to a node; and
- provisioning worker nodes proactively to avoid poor scaling.
If you prefer to read the code for this tutorial, you can find that on the LearnK8s GitHub.
How the Cluster Autoscaler Works in Kubernetes
The Cluster Autoscaler doesn’t look at memory or CPU availability when it triggers the autoscaling. Instead, the Cluster Autoscaler reacts to events and checks for any unschedulable pods. A pod is unschedulable when the scheduler cannot find a node that can accommodate it.
Let’s test this by creating a cluster.
bash
$ linode-cli lke cluster-create \
 --label learnk8s \
 --region eu-west \
 --k8s_version 1.23 \
 --node_pools.count 1 \
 --node_pools.type g6-standard-2 \
 --node_pools.autoscaler.enabled enabled \
 --node_pools.autoscaler.max 10 \
 --node_pools.autoscaler.min 1 \

$ linode-cli lke kubeconfig-view "insert cluster id here" --text | tail +2 | base64 -d > kubeconfig
You should pay attention to the following details:
- each node has 4GB memory and 2 vCPU (i.e. `g6-standard-2`);
- there’s a single node in the cluster; and
- the cluster autoscaler is configured to grow from 1 to 10 nodes.
You can verify that the installation is successful with:
bash
$ kubectl get pods -A --kubeconfig=kubeconfig
Exporting the kubeconfig file with an environment variable is usually more convenient.
You can do so with:
bash
$ export KUBECONFIG=${PWD}/kubeconfig
$ kubectl get pods
Excellent!
Deploying an Application
Let’s deploy an application that requires 1GB of memory and 250m* of CPU.Note: m = thousandth of a core, so 250m = 25% of the CPU
yaml
apiVersion: apps/v1
kind: Deployment
metadata:
 name: podinfo
spec:
 replicas: 1
 selector:
   matchLabels:
     app: podinfo
 template:
   metadata:
     labels:
       app: podinfo
   spec:
     containers:
       - name: podinfo
         image: stefanprodan/podinfo
         ports:
           - containerPort: 9898
         resources:
           requests:
             memory: 1G
             cpu: 250m
You can submit the resource to the cluster with:
bash
$ kubectl apply -f podinfo.yaml
As soon as you do that, you might notice a few things. First, three pods are almost immediately running, and one is pending.

And then:
- after a few minutes, the autoscaler creates an extra node; and
- the fourth pod is deployed in the new node.

Why is the fourth pod not deployed in the first node? Let’s dig into allocatable resources.
Allocatable Resources in Kubernetes Nodes
Pods deployed in your Kubernetes cluster consume memory, CPU, and storage resources.
However, on the same node, the operating system and the kubelet require memory and CPU.
In a Kubernetes worker node, memory and CPU are divided into:
- Resources needed to run the operating system and system daemons such as SSH, systemd, etc.
- Resources necessary to run Kubernetes agents such as the Kubelet, the container runtime, node problem detector, etc.
- Resources available to Pods.
- Resources reserved for the eviction threshold.
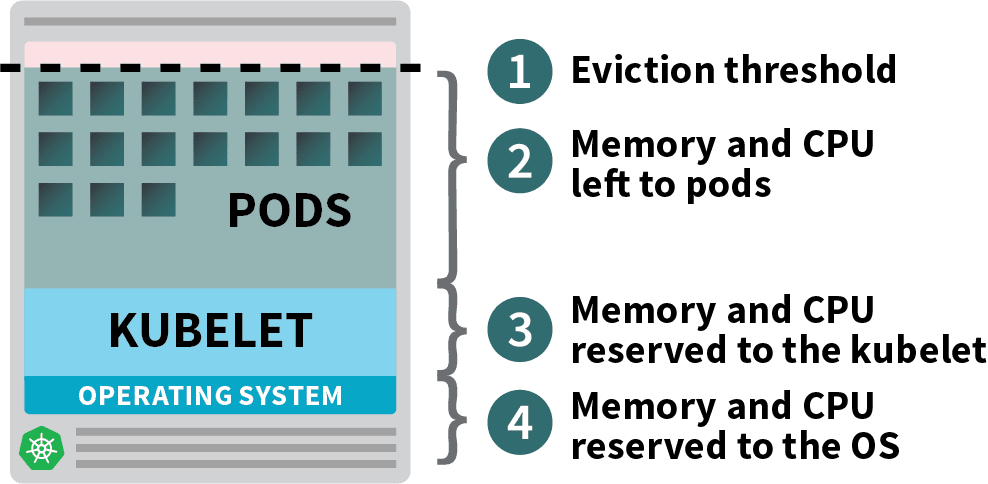
If your cluster runs a DaemonSet such as kube-proxy, you should further reduce the available memory and CPU.
So let’s lower the requirements to make sure that all pods can fit into a single node:
yaml
apiVersion: apps/v1
kind: Deployment
metadata:
 name: podinfo
spec:
 replicas: 4
 selector:
   matchLabels:
     app: podinfo
 template:
   metadata:
     labels:
       app: podinfo
   spec:
     containers:
       - name: podinfo
         image: stefanprodan/podinfo
         ports:
           - containerPort: 9898
         resources:
           requests:
             memory: 0.8G # <- lower memory
             cpu: 200m    # <- lower CPU
You can amend the deployment with:
bash
$ kubectl apply -f podinfo.yaml
Selecting the right amount of CPU and memory to optimize your instances could be tricky. The Learnk8s tool calculator might help you do this more quickly.
You fixed one issue, but what about the time it takes to create a new node?
Sooner or later, you will have more than four replicas. Do you really have to wait a few minutes before the new pods are created?
The short answer is yes.
Linode has to create a virtual machine from scratch, provision it, and connect it to the cluster. The process could easily take more than two minutes.
But there’s an alternative.
You could proactively create already provisioned nodes when you need them.
For example: you could configure the autoscaler to always have one spare node. When the pods are deployed in the spare node, the autoscaler can proactively create more. Unfortunately, the autoscaler does not have this built-in functionality, but you can easily recreate it.
You can create a pod that has requests equal to the resource of the node:
yaml
apiVersion: apps/v1
kind: Deployment
metadata:
 name: overprovisioning
spec:
 replicas: 1
 selector:
   matchLabels:
     run: overprovisioning
 template:
   metadata:
     labels:
       run: overprovisioning
   spec:
     containers:
       - name: pause
         image: k8s.gcr.io/pause
         resources:
           requests:
             cpu: 900m
             memory: 3.8G
You can submit the resource to the cluster with:
bash
kubectl apply -f placeholder.yaml
This pod does absolutely nothing.
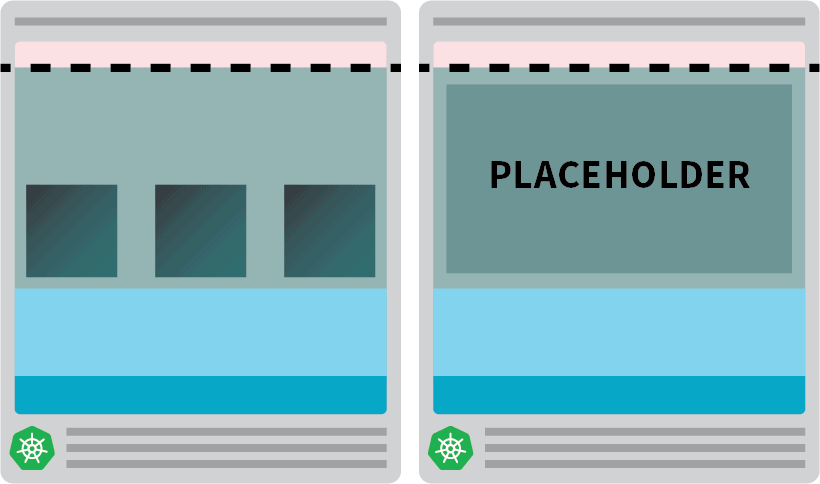
It just keeps the node fully occupied.
The next step is to make sure that the placeholder pod is evicted as soon as there’s a workload that needs scaling.
For that, you can use a Priority Class.
yaml
apiVersion: scheduling.k8s.io/v1
kind: PriorityClass
metadata:
 name: overprovisioning
value: -1
globalDefault: false
description: "Priority class used by overprovisioning."
---
apiVersion: apps/v1
kind: Deployment
metadata:
 name: overprovisioning
spec:
 replicas: 1
 selector:
   matchLabels:
     run: overprovisioning
 template:
   metadata:
     labels:
       run: overprovisioning
   spec:
     priorityClassName: overprovisioning # <--
     containers:
       - name: pause
         image: k8s.gcr.io/pause
         resources:
           requests:
             cpu: 900m
             memory: 3.8G
And resubmit it to the cluster with:
bash
kubectl apply -f placeholder.yaml
Now the setup is complete.
You might need to wait a bit for the autoscaler to create the node, but at this point , you should have two nodes:
- A node with four pods.
- Another with a placeholder pod.
What happens when you scale the deployment to 5 replicas? Will you have to wait for the autoscaler to create a new node?
Let’s test with:
bash
kubectl scale deployment/podinfo --replicas=5
You should observe:
- The fifth pod is created immediately, and it’s in the Running state in less than 10 seconds.
- The placeholder pod was evicted to make space for the pod.

And then:
- The cluster autoscaler noticed the pending placeholder pod and provisioned a new node.
- The placeholder pod is deployed in the newly created node.

Why proactively create a single node when you could have more?
You can scale the placeholder pod to several replicas. Each replica will pre-provision a Kubernetes node ready to accept standard workloads. However, those nodes still count against your cloud bill but sit idle and do nothing. So, you should be careful and not create too many of them.
Combining the Cluster Autoscaler with the Horizontal Pod Autoscaler
To understand this technique’s implication, let’s combine the cluster autoscaler with the Horizontal Pod Autoscaler (HPA). The HPA is designed to increase the replicas in your deployments.
As your application receives more traffic, you could have the autoscaler adjust the number of replicas to handle more requests.
When the pods exhaust all available resources, the cluster autoscaler will trigger creating a new node so that the HPA can continue creating more replicas.
Let’s test this by creating a new cluster:
bash
$ linode-cli lke cluster-create \
 --label learnk8s-hpa \
 --region eu-west \
 --k8s_version 1.23 \
 --node_pools.count 1 \
 --node_pools.type g6-standard-2 \
 --node_pools.autoscaler.enabled enabled \
 --node_pools.autoscaler.max 10 \
 --node_pools.autoscaler.min 3 \

$ linode-cli lke kubeconfig-view "insert cluster id here" --text | tail +2 | base64 -d > kubeconfig-hpa
You can verify that the installation is successful with:
bash
$ kubectl get pods -A --kubeconfig=kubeconfig-hpa
Exporting the kubeconfig file with an environment variable is more convenient.
You can do so with:
bash
$ export KUBECONFIG=${PWD}/kubeconfig-hpa
$ kubectl get pods
Excellent!
Let’s use Helm to install Prometheus and scrape metrics from the deployments.
You can find the instructions on how to install Helm on their official website.
bash
$ helm repo add prometheus-community https://prometheus-community.github.io/helm-charts
$ helm install prometheus prometheus-community/prometheus
Kubernetes offers the HPA a controller to increase and decrease replicas dynamically.
Unfortunately, the HPA has a few drawbacks:
- It doesn’t work out of the box. You need to install a Metrics Server to aggregate and expose the metrics.
- You can’t use PromQL queries out of the box.
Fortunately, you can use KEDA, which extends the HPA controller with some extra features (including reading metrics from Prometheus).
KEDA is an autoscaler made of three components:
- A Scaler
- A Metrics Adapter
- A Controller
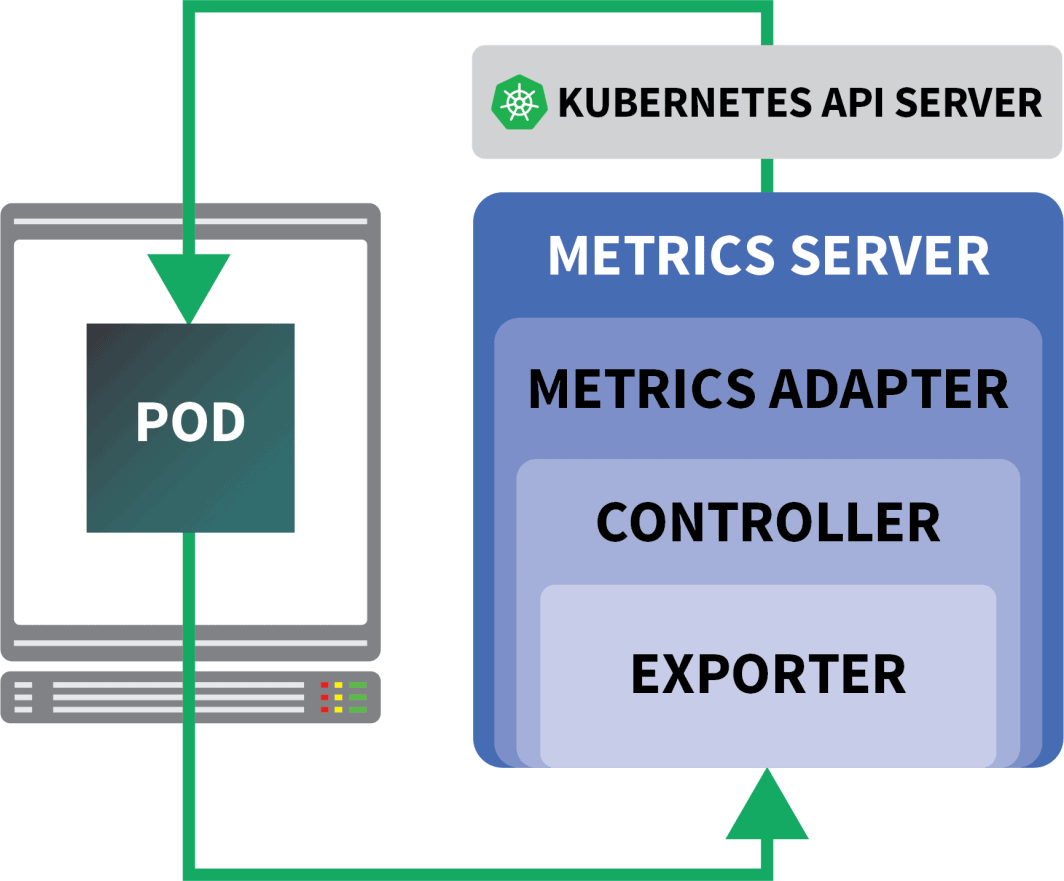
You can install KEDA with Helm:
bash
$ helm repo add kedacore https://kedacore.github.io/charts
$ helm install keda kedacore/keda
Now that Prometheus and KEDA are installed, let’s create a deployment.
For this experiment, you will use an app designed to handle a fixed number of requests per second.
Each pod can process at most ten requests per second. If the pod receives the 11th request, it will leave the request pending and process it later.
yaml
apiVersion: apps/v1
kind: Deployment
metadata:
 name: podinfo
spec:
 replicas: 4
 selector:
   matchLabels:
     app: podinfo
 template:
   metadata:
     labels:
       app: podinfo
     annotations:
       prometheus.io/scrape: "true"
   spec:
     containers:
       - name: podinfo
         image: learnk8s/rate-limiter:1.0.0
         imagePullPolicy: Always
         args: ["/app/index.js", "10"]
         ports:
           - containerPort: 8080
         resources:
           requests:
             memory: 0.9G
---
apiVersion: v1
kind: Service
metadata:
 name: podinfo
spec:
 ports:
   - port: 80
     targetPort: 8080
 selector:
   app: podinfo
You can submit the resource to the cluster with:
bash
$ kubectl apply -f rate-limiter.yaml
To generate some traffic, you will use Locust.
The following YAML definition creates a distributed load testing cluster:
yaml
apiVersion: v1
kind: ConfigMap
metadata:
 name: locust-script
data:
 locustfile.py: |-
   from locust import HttpUser, task, between

   class QuickstartUser(HttpUser):
       @task
       def hello_world(self):
           self.client.get("/", headers={"Host": "example.com"})
---
apiVersion: apps/v1
kind: Deployment
metadata:
 name: locust
spec:
 selector:
   matchLabels:
     app: locust-primary
 template:
   metadata:
     labels:
       app: locust-primary
   spec:
     containers:
       - name: locust
         image: locustio/locust
         args: ["--master"]
         ports:
           - containerPort: 5557
             name: comm
           - containerPort: 5558
             name: comm-plus-1
           - containerPort: 8089
             name: web-ui
         volumeMounts:
           - mountPath: /home/locust
             name: locust-script
     volumes:
       - name: locust-script
         configMap:
           name: locust-script
---
apiVersion: v1
kind: Service
metadata:
 name: locust
spec:
 ports:
   - port: 5557
     name: communication
   - port: 5558
     name: communication-plus-1
   - port: 80
     targetPort: 8089
     name: web-ui
 selector:
   app: locust-primary
 type: LoadBalancer
---
apiVersion: apps/v1
kind: DaemonSet
metadata:
 name: locust
spec:
 selector:
   matchLabels:
     app: locust-worker
 template:
   metadata:
     labels:
       app: locust-worker
   spec:
     containers:
       - name: locust
         image: locustio/locust
         args: ["--worker", "--master-host=locust"]
         volumeMounts:
           - mountPath: /home/locust
             name: locust-script
     volumes:
       - name: locust-script
         configMap:
           name: locust-script
You can submit it to the cluster with:
bash
$ kubectl locust.yaml
Locust reads the following locustfile.py, which is stored in a ConfigMap:
py
from locust import HttpUser, task, between

class QuickstartUser(HttpUser):

   @task
   def hello_world(self):
       self.client.get("/")
The file doesn’t do anything special apart from making a request to a URL. To connect to the Locust dashboard, you need the IP address of its load balancer.
You can retrieve it with the following command:
bash
$ kubectl get service locust -o jsonpath='{.status.loadBalancer.ingress[0].ip}'
Open your browser and enter that IP address.
Excellent!
There’s one piece missing: the Horizontal Pod Autoscaler.
The KEDA autoscaler wraps the Horizontal Autoscaler with a specific object called ScaledObject.
yaml
apiVersion: keda.sh/v1alpha1
kind: ScaledObject
metadata:
name: podinfo
spec:
scaleTargetRef:
  kind: Deployment
  name: podinfo
minReplicaCount: 1
maxReplicaCount: 30
cooldownPeriod: 30
pollingInterval: 1
triggers:
- type: prometheus
  metadata:
    serverAddress: http://prometheus-server
    metricName: connections_active_keda
    query: |
      sum(increase(http_requests_total{app="podinfo"}[60s]))
    threshold: "480" # 8rps * 60s
KEDA bridges the metrics collected by Prometheus and feeds them to Kubernetes.
Finally, it creates a Horizontal Pod Autoscaler (HPA) with those metrics.
You can manually inspect the HPA with:
bash
$ kubectl get hpa
$ kubectl describe hpa keda-hpa-podinfo
You can submit the object with:
bash
$ kubectl apply -f scaled-object.yaml
It’s time to test if the scaling works.
In the Locust dashboard, launch an experiment with the following settings:
- Number of users:
300 - Spawn rate:
0.4 - Host:
http://podinfo
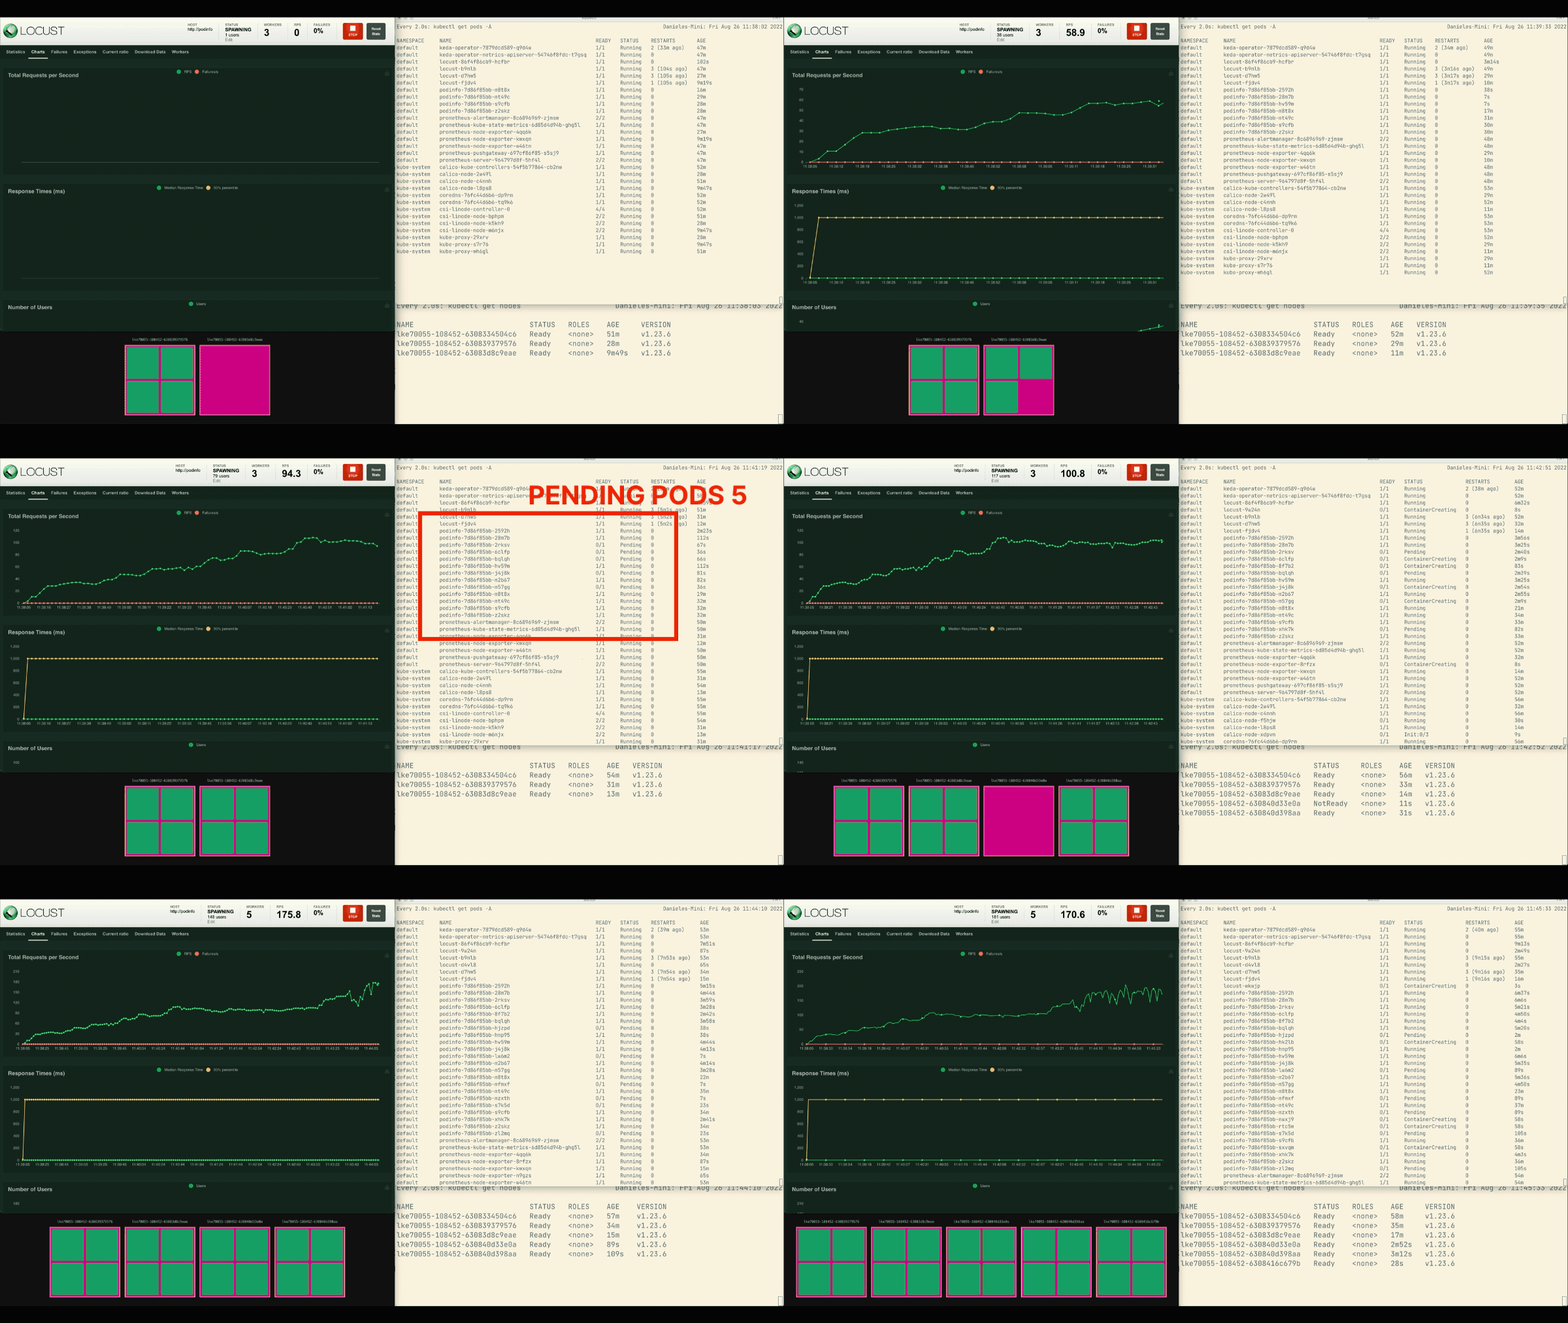
The number of replicas is increasing!
Excellent! But did you notice?
After the deployment scales to 8 pods, it has to wait a few minutes before more pods are created in the new node.
In this period, the requests per second stagnate because the current eight replicas can only handle ten requests each.
Let’s scale down and repeat the experiment:
bash
kubectl scale deployment/podinfo --replicas=4 # or wait for the autoscaler to remove pods
This time, let’s overprovision the node with the placeholder pod:
yaml
apiVersion: scheduling.k8s.io/v1
kind: PriorityClass
metadata:
 name: overprovisioning
value: -1
globalDefault: false
description: "Priority class used by overprovisioning."
---
apiVersion: apps/v1
kind: Deployment
metadata:
 name: overprovisioning
spec:
 replicas: 1
 selector:
   matchLabels:
     run: overprovisioning
 template:
   metadata:
     labels:
       run: overprovisioning
   spec:
     priorityClassName: overprovisioning
     containers:
       - name: pause
         image: k8s.gcr.io/pause
         resources:
           requests:
             cpu: 900m
             memory: 3.9G
You can submit it to the cluster with:
bash
kubectl apply -f placeholder.yaml
Open the Locust dashboard and repeat the experiment with the following settings:
- Number of users:
300 - Spawn rate:
0.4 - Host:
http://podinfo
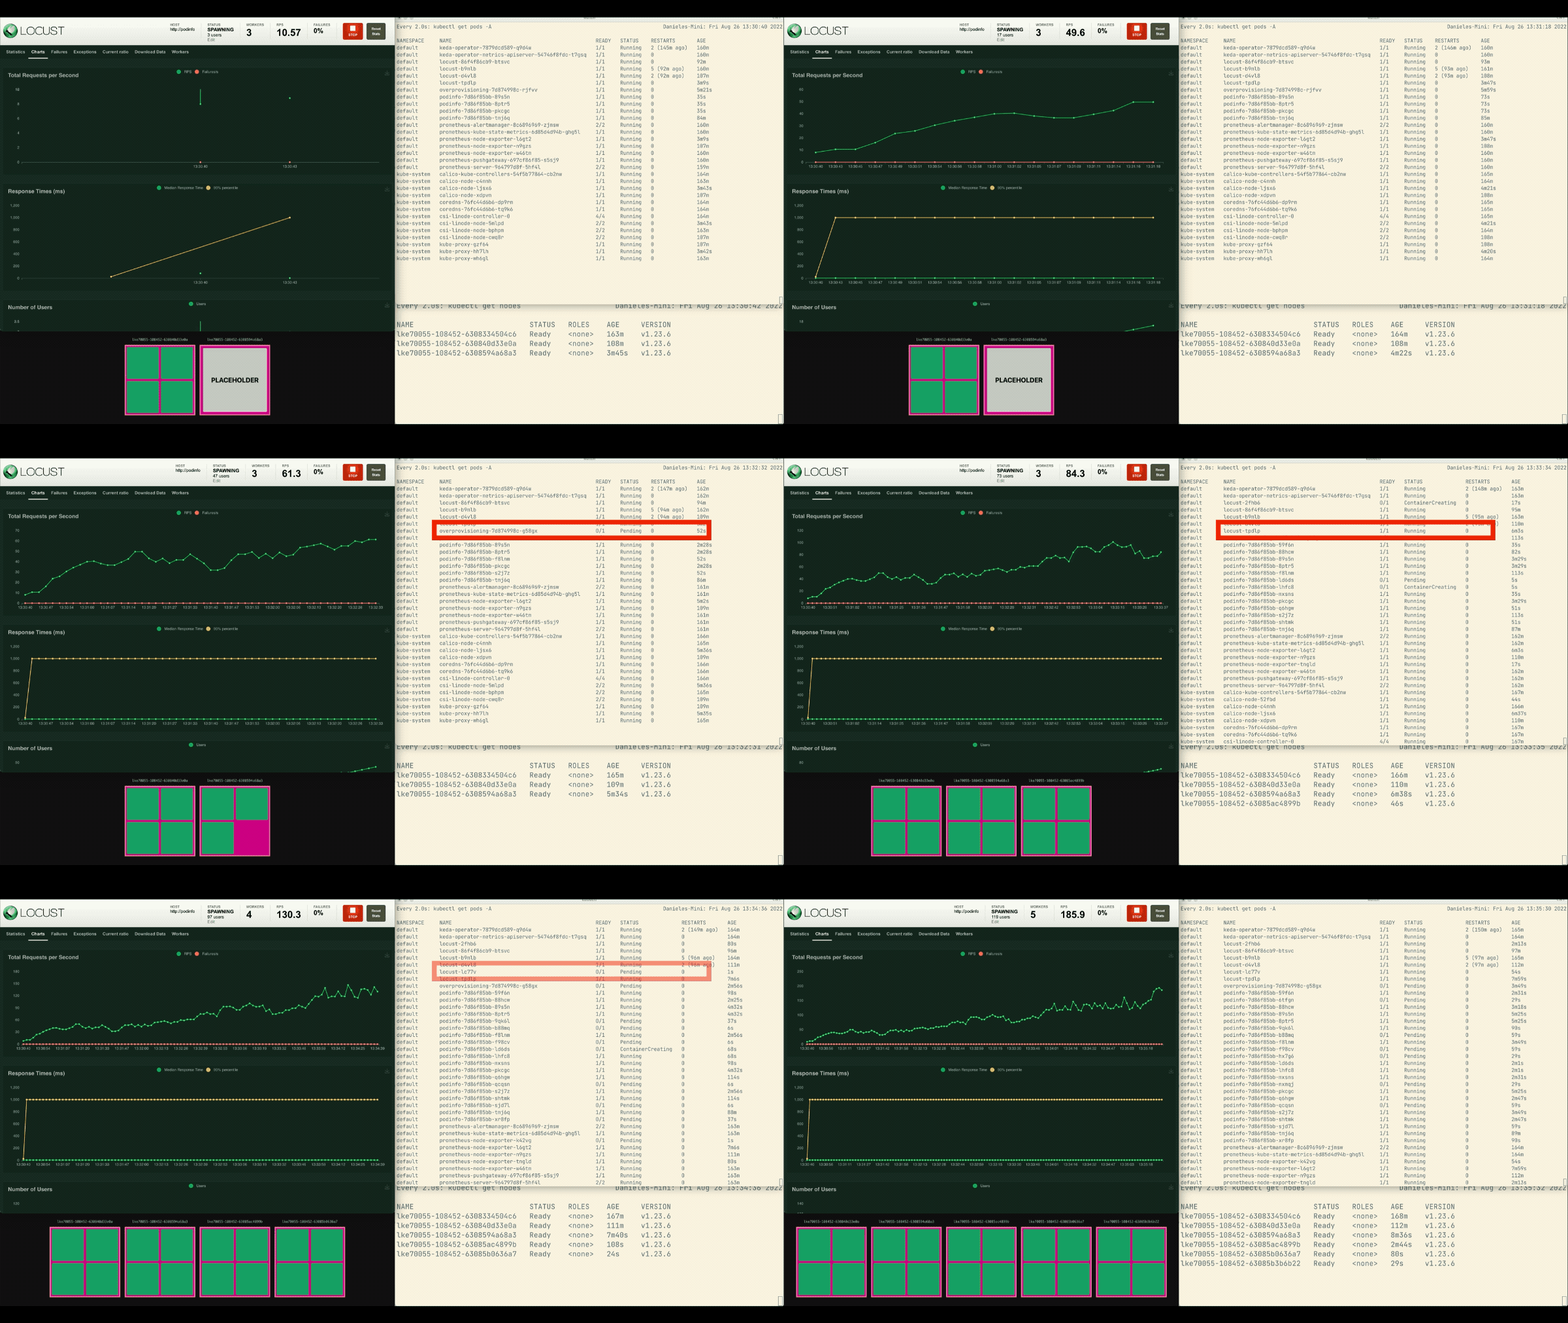
This time, new nodes are created in the background and the requests per second increase without flattening. Great job!
Let’s recap what you learned in this post:
- the cluster autoscaler doesn’t track CPU or memory consumption. Instead, it monitors pending pods;
- you can create a pod that uses the total memory and CPU available to provision a Kubernetes node proactively;
- Kubernetes nodes have reserved resources for kubelet, operating system, and eviction threshold; and
- you can combine Prometheus with KEDA to scale your pod with a PromQL query.
Want to follow along with our Scaling Kubernetes webinar series? Register to get started, and learn more about using KEDA to scale Kubernetes clusters to zero.




Comments