Open source monitoring platform to gain deep insight into the performance of applications and databases.
Percona Monitoring & Management is a free, best-of-breed, open source database monitoring and management solution. It helps enterprises reduce complexity and simplify management, while optimizing performance and improving the security of your business-critical database environments, no matter where they are located, including on-premises or in the cloud.
Gain more insight in seconds by deploying the Percona Monitoring & Management One-Click App on Linode.
Software Included
| SOFTWARE | DESCRIPTION |
|---|---|
| Docker | Docker is used to containerize Percona PMM. |
| Grafana | Grafana is a visualization tool that provides charts, graphs, and alerts. Provides these tools for Percona PMM |
| pmm-adPMM Server | PMM Server is the central part of PMM that aggregates collected data and presents it in the form of tables, dashboards, and graphs in a web interface. |
Getting Started After Deployment
Access Your Percona Monitoring and Management Server’s Grafana Dashboard
After the Percona Monitoring and Management server has finished installing, you will be able to access its Grafana dashboard it over http:// with your Linode’s IPv4 address. To find your Linode’s IPv4 address:
- Click on the Linodes link in the sidebar. You will see a list of all your Linodes.
- Find the Linode you just created when deploying your app and select it.
- Navigate to the Networking tab.
- Your IPv4 address will be listed under the Address column in the IPv4 table.
- Copy and paste the IPv4 address into a browser window. Ensure you are using
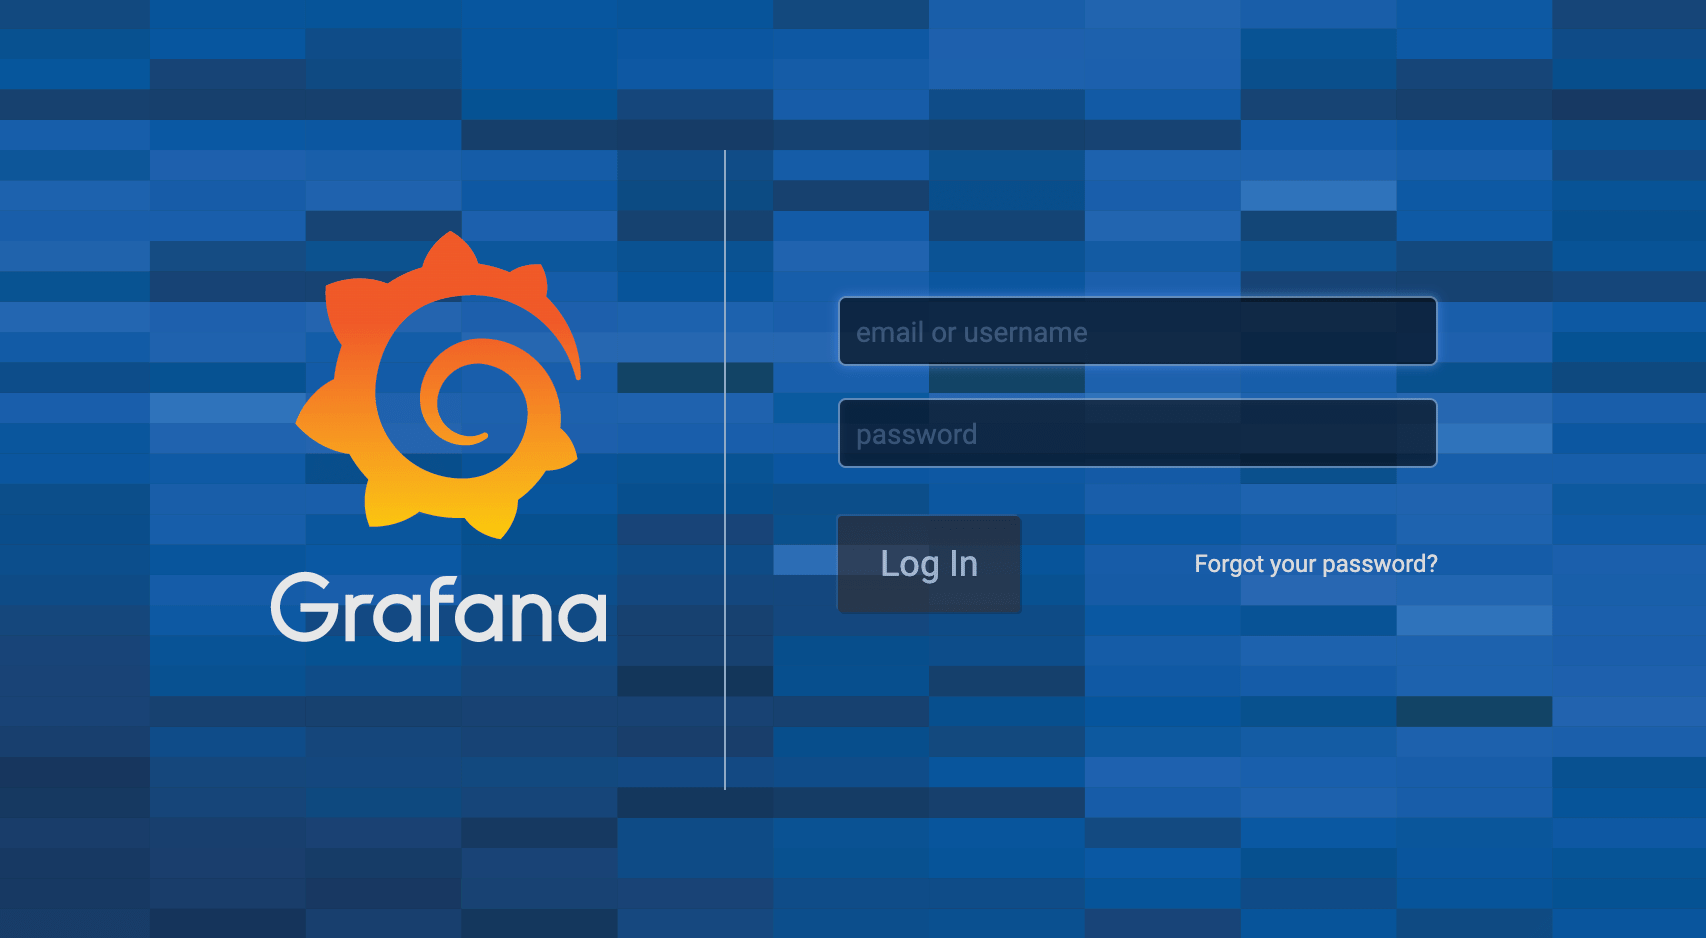
http://. - You will see the Grafana login screen:

- Enter the following default values for username and password, then click the Log In button:
Entry Default Valuen
Username admin
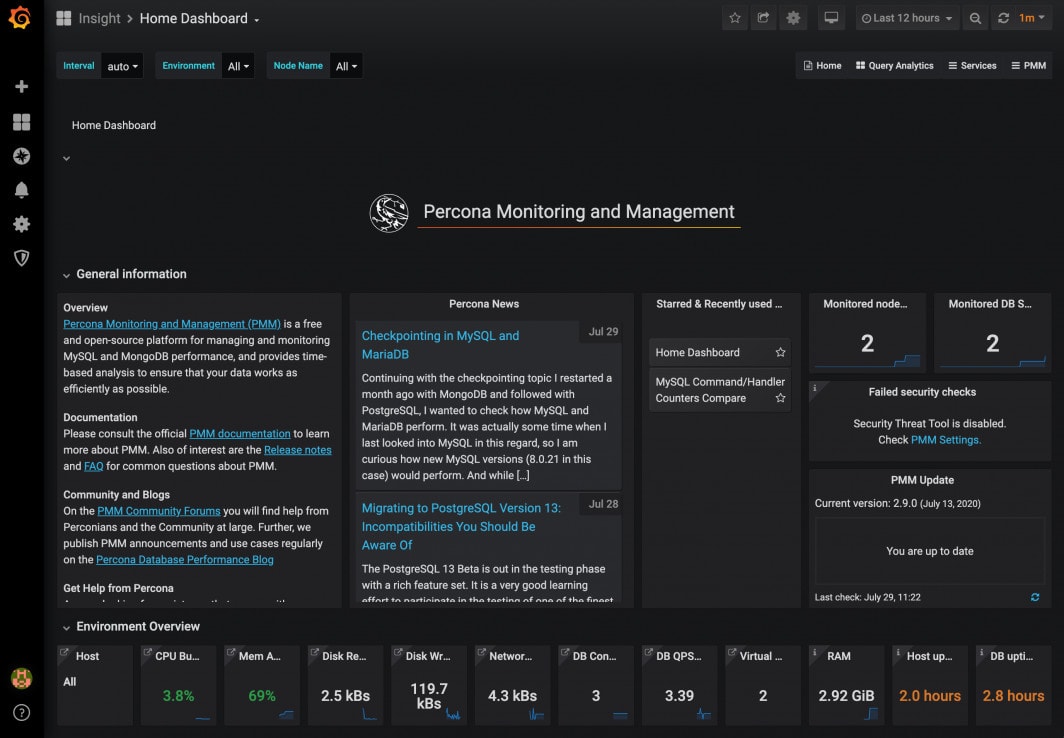
Password The admin password you selected wheyou created the app. - You will then see the PMM Home Dashboard actively monitoring your server:

Installing the Percona Monitoring and Management Client
To begin monitoring a database node, you will need to install the PMM Client on the Linode that hosts your database and connect the node to the PMM Server.
- Deploying MySQL/MariaDB with Marketplace Apps
- Deploying PostgreSQL with Marketplace Apps
- Deploying MongoDB with Marketplace Apps
Note: The PMM Server deployed with Linode’s Percona (PMM) Marketplace App is compatible with PMM Client version 2.
- Connect to your Linode via SSH.
- Update your system’s software.
Debian or Ubuntusudo apt-get update && apt-get upgrade
CentOSsudo yum update
3. Configure Percona repositories using the percona-release tool. First you’ll need to download and install the official percona-release package from Percona::
Debian or Ubuntu:
 wget https://repo.percona.com/apt/percona-release_latest.generic_all.deb
 sudo dpkg -i percona-release_latest.generic_all.deb
CentOS:
sudo yum install https://repo.percona.com/yum/percona-release-latest.noarch.rpm4.
Install the PMM Client (version 2):
Debian or Ubuntu:
 sudo apt-get update
 sudo apt-get install pmm2-client
CentOS:
sudo yum install pmm2-client5.
Connect your database node to the PMM Server. Replace admin_password with your PMM Server’s Grafana password, and 192.0.2.0 with your PMM Server’s IPv4 address.
Note: Follow the steps in Find Your Linode’s IP Address to retrieve your PMM Server’s IPv4 address.
pmm-admin \ config \ --server-insecure-tls \ --server-url=https://admin:admin_password@192.0.2.0:443
Once complete, you should see a similar output:
Checking local pmm-agent status...
pmm-agent is running.
Registering pmm-agent on PMM Server...
Registered.
Configuration file /usr/local/percona/pmm2/config/pmm-agent.yaml updated.
Reloading pmm-agent configuration...
Configuration reloaded.
Checking local pmm-agent status...
pmm-agent is running.
Monitor a Database Instance
Once your database node and your Percona Monitoring and Management Server are communicating, the final step is to add your database instance to be monitored by your PMM Server. These steps are completed on your Database node.
- Connect to your Linode via SSH.
- Add your database instance to be monitored by your PMM Server. This command will add a MySQL database instance to be monitored. You can replace
mysqlwith the database type that your node is hosting (i.e.postgresqlormongodb). See Percona’s Managing PMM Client documentation for details.pmm-admin add mysql
Your Percona dashboard should now be monitoring your MySQL service.
Note: You can also add a database remote instance node using the Grafana interface. In order to do this, your node must be configured with a public DNS name. This method of adding a remote database instance will not provide host-level metrics.
Next Steps
The Percona Monitoring Management Tool is very powerful and can be configured to monitor and display various pieces of your database instances. Once you have completed the basic configurations outlined in this guide, you should review Percona’s documentation to learn more about the PMM tool. Here are some suggested topics:
