Splunk is a data platform that allows developers and organizations to leverage more data in security best practices, DevOps, and workflow optimization. It makes data more human-readable with customizable dashboards and tables that are easy to modify and share with your team or clients.
We recently added Splunk to the Linode Marketplace so you can easily deploy and start building your self-hosted data store. You can also create advanced monitoring for Linode account management and events, like tracking maintenance events or application user activity.
Our Developer Experience team focuses on integrations that make Linode easier to use with your existing tools that are supporting workloads, including the Linode Terraform Provider. This same team built the Linode Add-On for Splunk, which allows you to pull information using the Linode API to customize account monitoring. Collect real-time data about your account and compute instances, including creation, resizing, logins, invoices, and other notifications. The Splunk add-on does rely on the Linode API, which has plenty of supporting documentation to get started.
Here are three ideas using the Linode Splunk Add-On after deploying a Splunk instance on the Marketplace. Splunk is the perfect application for:
- Creating a customizable log of certain Linode events
- Setting up account/user monitoring for your Linode account
- Tracking maintenance notifications
When creating a Splunk account and deploying the Splunk Marketplace app, you automatically gain access to a 60-day free trial that includes features found in Splunk Enterprise. After the trial period, you can continue with the free version or sign up for an enterprise license.
Using Linode and Splunk
Set up a read-only API token under your profile in the Linode Cloud Manager. You can use the API token to create different inputs in Splunk for the following events:
- Linode Account Invoices
- Linode Account Payments
- Linode Account Events
- Linode Service Transfers
- Linode Account Logins
- Linode Account Notifications
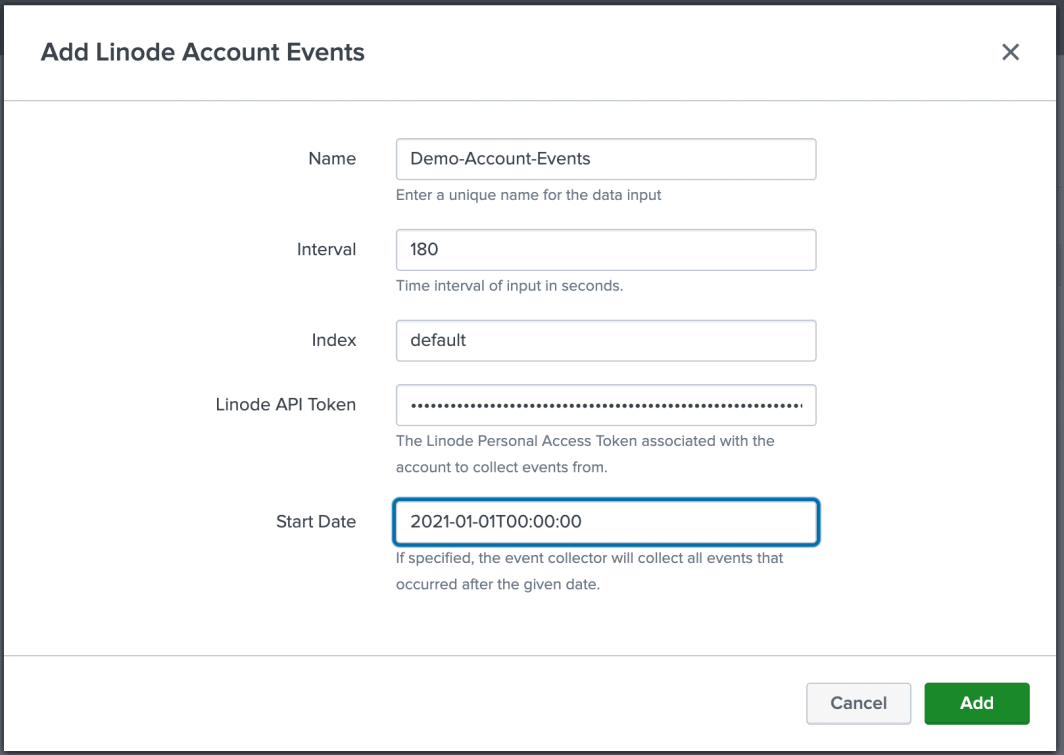
Next, you can create custom queries for each input to search for and track the information you’re looking to find.
Tracking Different Events
The Account Events endpoint retroactively imports events as far back as 90 days, but once you have information saved in your Splunk instance, you can collect real-time data that will be stored in a data warehouse related to your cloud infrastructure.
To view a timeline or log of all Linode events, enter linode_account_events as your sourcetype and customize the fields based on what you want to know.

If you want to track a specific type of event, you can narrow down the search to action=linode_create.
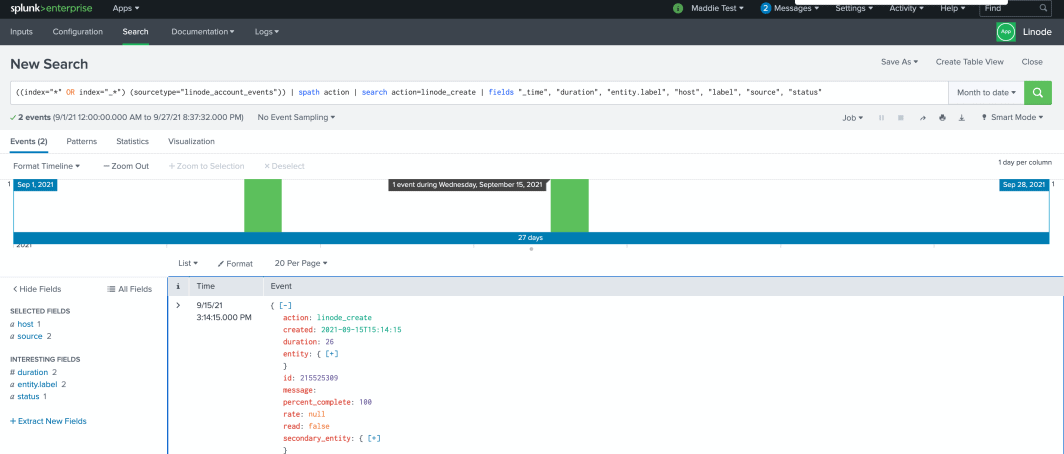
Monitoring User Activity
Whether you have multiple users sharing a Linode account with different permissions or you want an extra level of account monitoring to ensure account information isn’t compromised, there are a couple of ways to do this with Splunk.
The basic function for this is to track who logs in, when they do it, and their IP address, so you can look for any login behavior outliers. This is a great example of quickly converting your search into a Table.
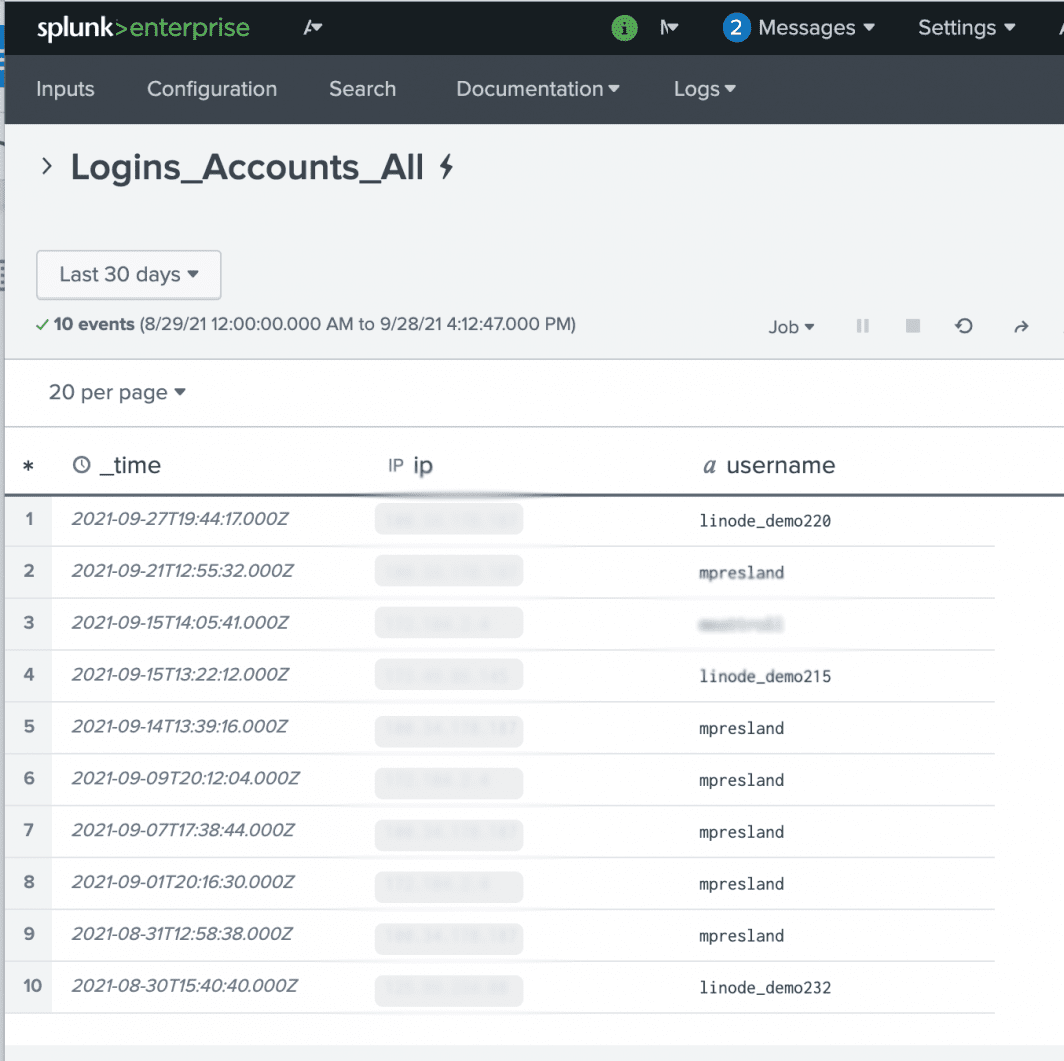
To track more than just user logins, you need to create and search an Events input. In your search query, add username to see usernames next to all events. input. To narrow down the output to specific user(s), add | spath username | search username=your_user | to see all events by that user.

Creating a log like this and knowing how to change the query can help you troubleshoot when something goes awry, and the actions taken by a colleague (or client) so you can get the initial steps to reproduce or fix the issue.
Maintenance Notifications
To get a general log of maintenance notifications, create a Notifications endpoint and do a general search to view past messages regarding Linode maintenance. From there, you can narrow down your search by severity, label, or other endpoints on the Notifications API endpoint list.
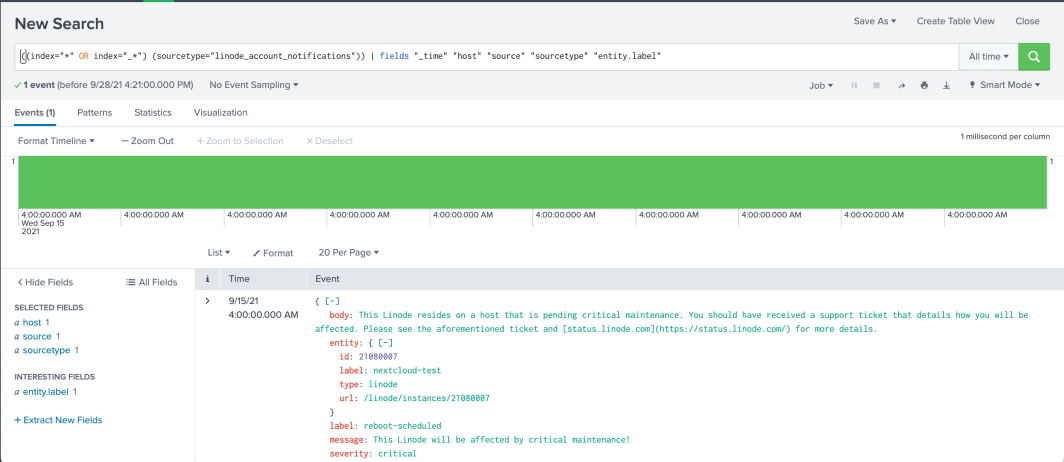
The Linode API is robust in terms of account actions. Combining this with obtaining historical data with Splunk gives you more advanced account monitoring that can ultimately help you troubleshoot more efficiently and reduce resources when possible.
After defining a few useful queries and figuring out exactly what you want to monitor, you can follow Splunk’s official documentation to learn more about building visual dashboards, converting search results into tables, and creating custom alerts. As we continue to add more functionality to our API, you’ll be able to get even more in-depth monitoring in Splunk.
Want to contribute to the Linode Add-On for Splunk or help us with our documentation? Check out the project on GitHub.




Comments